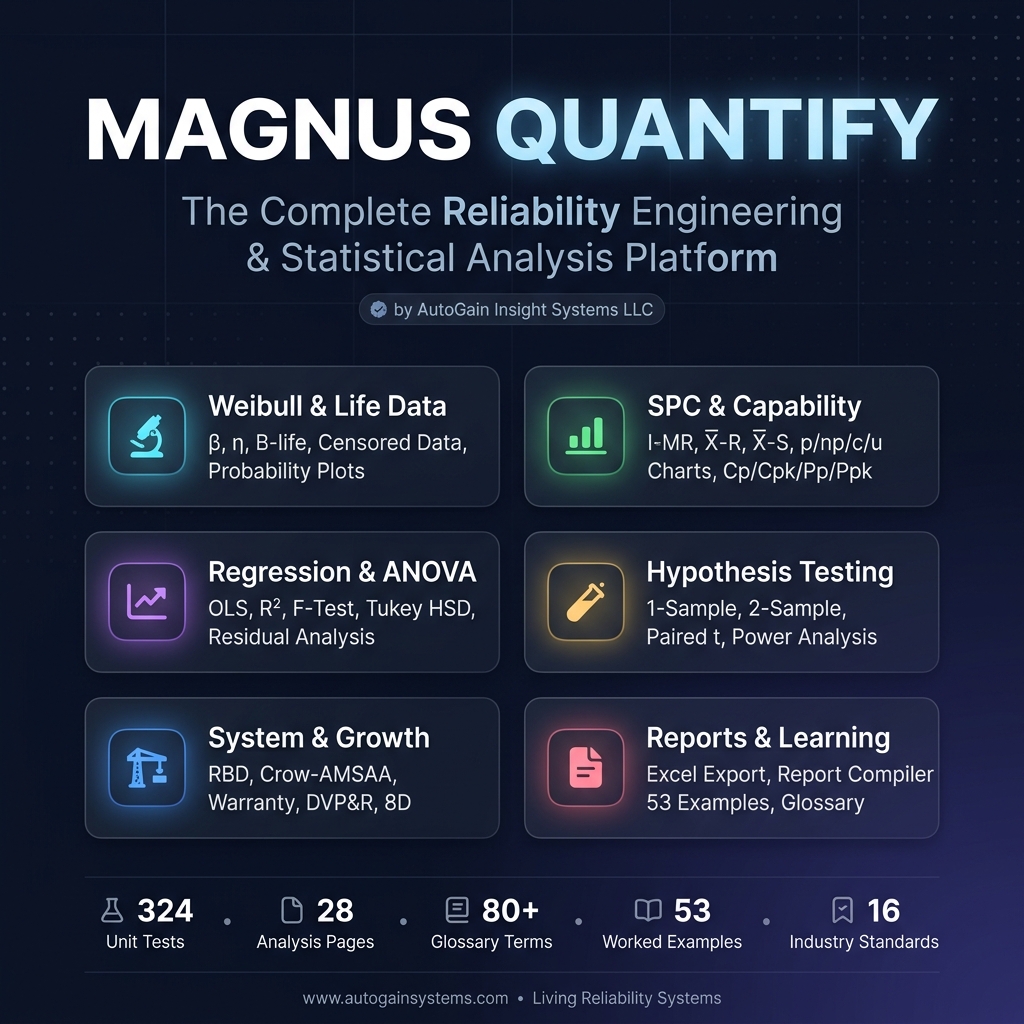
28 Analysis Modules
Everything a Reliability Engineer Needs
From life data analysis through warranty prediction — every tool is validated, documented, and connected.
📈
Weibull Analysis
2P and 3P Weibull MLE fitting. B-life, probability plots, hazard rate, confidence bounds. Censored data with Kaplan-Meier.
MLE
Censored Data
🔔
Distribution Fitting
Lognormal, exponential, competing risks. Automatic KS goodness-of-fit comparison. Bathtub curve decomposition.
KS Test
BIC/AIC
📊
SPC Control Charts
I-MR, X-bar/R, X-bar/S, p/np/c/u attribute charts. Western Electric rules, automatic OOC detection.
AIAG SPC
ISO 7870
📏
Process Capability
Cp, Cpk, Pp, Ppk, Cpm (Taguchi). PPM estimation, histogram overlay with spec limits. PPAP-ready reports.
IATF 16949
PPAP
🧪
Hypothesis Testing
1-sample, 2-sample (Welch), paired t-tests. Power analysis with sample size calculator. Cohen's d effect size.
Power Curves
📐
MSA / Gage R&R
Crossed ANOVA Gage R&R. %GRR, repeatability, reproducibility, ndc. AIAG MSA 4th Edition acceptance criteria.
AIAG MSA
📈
Linear Regression
OLS fitted-line plot with confidence bands. R², adjusted R², F-test, residual analysis, coefficient p-values.
📊
1-Way ANOVA + Tukey
Compare 3+ group means. SSB/SSW partition, F-test. Tukey HSD post-hoc pairwise comparison with family-wise error control.
🔄
Reliability Growth
Crow-AMSAA NHPP model. Growth rate β, instantaneous MTBF, target projection. MIL-HDBK-189 / IEC 61164.
NHPP
MIL-HDBK-189
🏗️
System Reliability (RBD)
Series, parallel, k-of-n voting configurations. R(t) curves, reliability allocation, and configuration comparison.
💰
Warranty Analysis
Weibull-based cost projection. MIS claim rate analysis, what-if scenarios for extended warranty and design improvements.
🔍
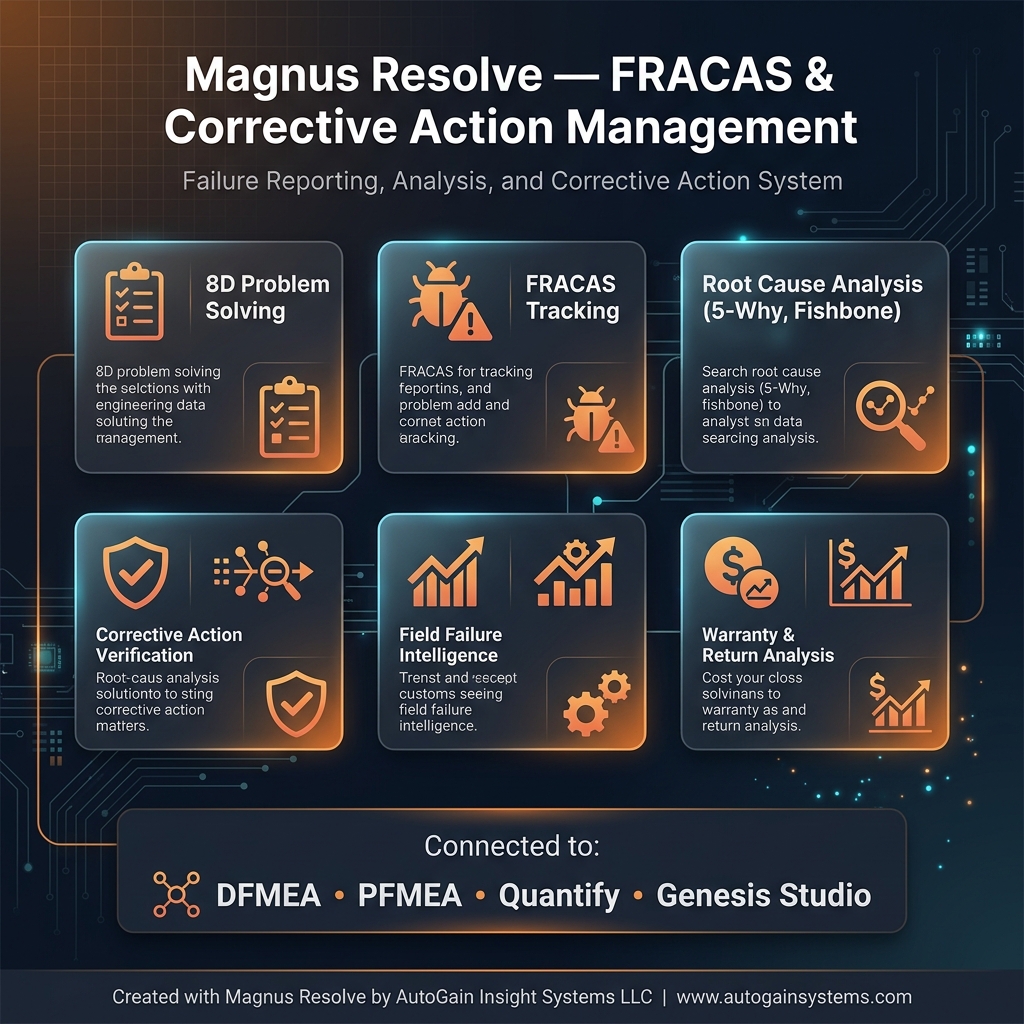
8D Problem Solving
Full D1–D8 framework with built-in Pareto analysis, 5-Why root cause, and corrective action tracking.
AIAG CQI-20
🌡️
Accelerated Life Testing
Arrhenius, Inverse Power Law, Eyring, Coffin-Manson. Acceleration factor curves. JEDEC, AEC-Q100/Q200 compliant.
AEC-Q100
JEDEC
📋
DVP&R
Interactive test matrix mapping requirements → tests → acceptance criteria. Coverage metrics and gap analysis before design freeze.
APQP Phase 3
🔬
Data Analysis Flow
Full Quantify Math Core pipeline: target → sample size → distributions → failure event → Pf → ALT → evidence → release decision.
9-Stage Pipeline
🧪
R90/C95 Demo Planner
Interactive 9-step reliability demonstration: zero-failure sample size, binomial planning, AF calculator, waterfall chart, and release verdict.
🎓
Model Cards
Every analysis page opens with an expandable info card: overview, step-by-step usage, key insights. Expanded by default.
📚
53 Worked Examples
Every example includes WHY, WHAT inputs/outputs, HOW (step-by-step with numbers), interpretation, and real-world application context.
📖
80+ Term Glossary
Hover over any statistical term to see its definition. Auto-annotated across all pages. β, η, MLE, BIC, MTBF, Cp, Cpk, GRR, and 70+ more.
📄
Report Generator
14 analysis-specific report templates. PPAP, ISO 13485, DO-178C, MIL-STD formats. Content preview and customizable sections.